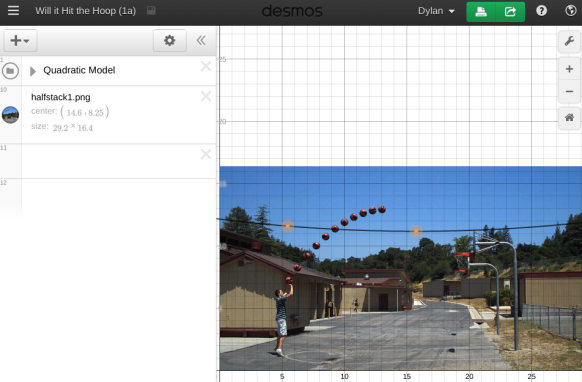
I wrote a long time ago about Dan Meyer’s Will It Hit The Hoop lesson and my take on it using Desmos — my post is here, and Dan’s is here. In short, Dan took a bunch of videos of him shooting hoops, and the student’s job is to take half of the arc of the shot and predict whether it will go in, with lots of different directions the class can go from there.

Big thanks to James Cleveland, who pointed out that Desmos improved the quality of images you can import since my original post. I went back through and updated my graphs with the higher-resolution images — they make a big difference, and remove one of the unnecessary blocks for students in this lesson.
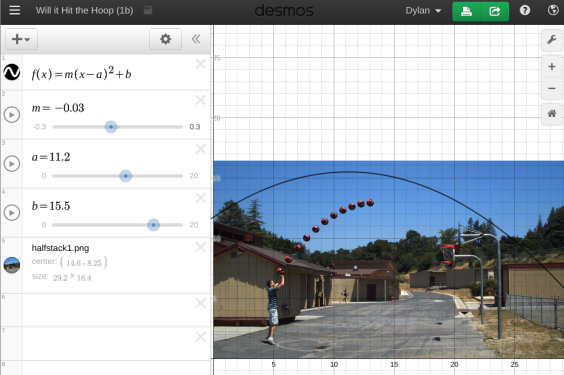
I also put a second set of graphs together, based on how I used this with my students recently. The first set of graphs involves dragging two points on the quadratics to fit the curve of the shot. The second set of graphs puts the equations in vertex form, and has the students adjust sliders to change the coefficients. There are lots of ways to do this — I had students use the first set for shots 1-4 to get them familiar with the idea and with the shape and structure of quadratics. Then, I gave them the graphs in vertex form for shots 5-7, and after they had finished they answered a few analysis questions about what each part of the function represented, and why that was the case. I think this made a big difference in students’ mathematical thinking around the problem, rather than just “answer-getting” in a niftier format but without the mathematics I was looking for. Vertex graphs look like this:

Oh – and don’t forget to go to Dan’s post for the videos so students can see which shots actually went in and validate their predictions. There are some fun results! The zipped folder with all of the images and videos is here.
Here are my Desmos graphs —
Draggable version:
Take 1
Take 2
Take 3
Take 4
Take 5
Take 6
Take 7
Vertex form:
Take 1
Take 2
Take 3
Take 4
Take 5
Take 6
Take 7
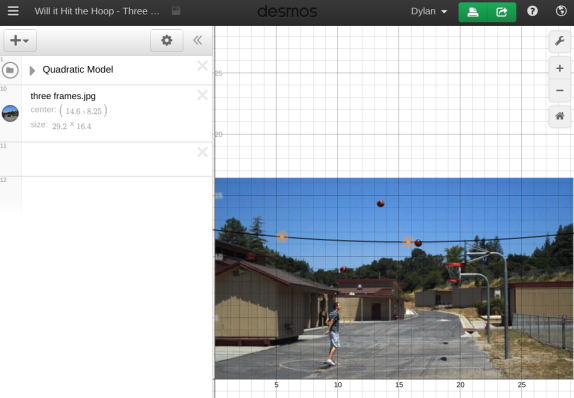
Hope these are useful for some people. It’s a fun lesson, and I think it may have a lot more potential than where I took it. Dan tries to use this to motivate the idea that there are infinitely many parabolas that go through two points, but a unique parabola through three points. Here are some graphs that could be used to illustrate this — I haven’t used these with students, and I’m a bit skeptical that it’s the best motivation from this situation, but could be a fun question for more advanced students:

Here are several things that spring to mind:
1. Questions about “reality”. Will it always be a parabola? Why is it a parabola? If it was a balloon would I get a parabola?
2. Seeing situations where a parabola is not a very good fit. The simple one is a hanging chain (catenary)
3. From the video stills, can one say anything about the change in vertical (and possible horizontal as well) speed of the ball ?
I tweaked this to use with my students tomorrow. I think they will enjoy it! Thanks for putting the images into Desmos.
You’re welcome — let me know how it goes!
Thanks for the post. I’ve been doing this lesson for a while now and I’ve never thought about having students initially drag the points to get them comfortable working with parabolas. Actually, I’ve never created a graph like that using Desmos. I’ll find some time to play around with this.
Yea, I like getting students an intuition for parabolas by dragging them around. It can be tough to get students to move from there to thinking about different forms of a parabola and their properties, but it’s a great hook.