I wrote recently about learning distributions, thinking about which of the following graphs best represent my class.


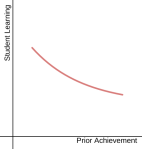


It was a fun thought experiment. I think that my actual classes usually play out something like this:
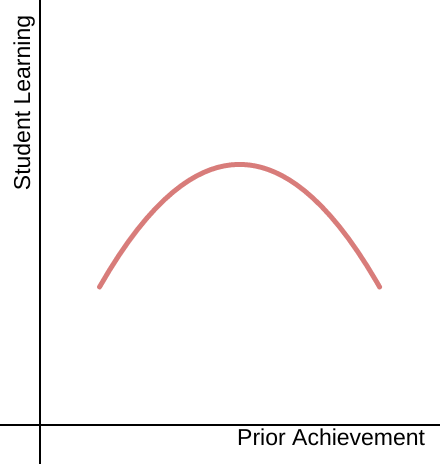
It’s just the easiest to teach students in the middle, without challenging high-achieving students or providing adequate support for strugglers. Not something I’m proud of, but it’s the reality most days.
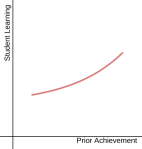
I think my ideal class looks something like this:

I see this as a moral question — if kids have struggled in the past, they need to be my priority in the future. But I think that it can be practical as well. I don’t want to restrict my thinking to narrow learning goals. Hopefully every student moves their thinking forward with the content we’re looking at in class. But students on the left side of that graph often have other learning goals that are important. Social goals around how students learn together. Goals for students’ beliefs and mindset toward math. Foundational skills that those students are learning in addition to content goals for that day of class. With a large menu of possibilities, achieving that distribution seems more doable.
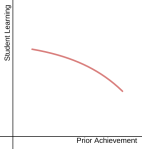
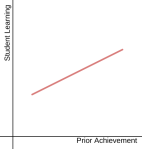
I think it’s also important to think about the difference between these two graphs:


In one, every student learns a lot, every class. I don’t want to shortchange high-achieving students, I just want to broaden what I am able to do to support students who need that support the most.

Pingback: Learning Distributions Redux | Five Twelve Thirteen